Persona reports
Overview
To see an overview of persona scoring activity, navigate to the Analytics dashboard and open the Personas page.
The page has the following major sections:
- In the first section, you get a glimpse of the personas trend, or how many visitors scored points towards personas in the period that you define.
- In the second section, you see charts visualizing data about the number of unique daily visitors who belong to the persona.
Hover over dates to see an exact number of visitors who passed a threshold and the respective persona's name. If more than one persona thresholds are passed, you can choose to see a trend graph for specific personas.
- In the third section, you see the full statistics for all your defined personas.
- In the fourth section, you see a heatmap that enables you to quickly understand which of the personas, you are tracking as visitors, convert more or less.
You can choose the time range for which you want to see reports - for example, just for yesterday or as far back as the past six months.
To do this, use the dropdown box, located below the Personas title.
Persona summary
In the top section of this report, you see summarized information for the personas’ performance on your site.
Recognized as personas
The leftmost icon - Recognized as personas, displays all visitors who have been classified as at least one of your personas, during the chosen time range.
In this tile, you see the following:

It contains the following information:
- All visitors who are recognized as any persona during the selected time range.
In the screenshot above, these are 394.
- The total number of visitors in this data center, since it was created.
In the screenshot above, these are 33,657 visitors.
- The number of all visitors in all personas in this data center, since it was created.
In the screenshot above, these are 5,582 for all time.
Top performing personas
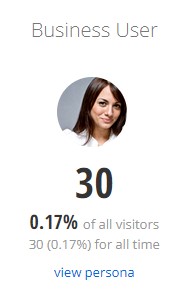
After this, you see the top-performing personas.
For each persona, you see the following:

For each persona, you see the following information:
- The number of visitors who entered the persona, during the selected time range.
In the screenshot, these are 30 visitors.
- The ratio of visitors who entered the persona to the number of all visitors who entered any persona, during the selected time range.
In the screenshot, the ratio is 0.17%.
- The number of visitors currently belonging to the persona.
In the screenshot, these are 30.
- The ratio of visitors currently in the persona to all visitors belonging to all personas in the data center.
In the screenshot, this ratio is 0.17%.
All personas
If you have defined more than five personas, only the top four are visible.
To see all personas, click All personas.
This action scrolls the screen to the Personas details section, where you can see all details for all personas.
More actions
To edit the persona scoring threshold, click Edit persona scoring.
This affects the persona scoring statistics. For more information, see Retroactive scoring calculation.
NOTE: When the persona threshold is edited, in the top-right corner of the report, you can see Redefined on. This gives you information about when and by whom the persona definition was modified.
Active visitors
In this chart, for each day in the selected time range, you see how many active visitors belong in the selected personas. Active visitors are visitors who performed at least one action on your site.
- On the X-axis, you see each day from the time range.
- On the Y-axis, you see the number of active visitors that belonged in the specific persona.
To see a tooltip with the exact number of visitors for each persona, hover over a specific day in the chart.
By default, you see the three personas with the most passed thresholds. If you want to select other personas, click  (Change).A new dialog appears where you can select any number of personas.
Visitors passed persona thresholds
In this chart, for each day in the selected time range, you see how many visitors passed specific persona thresholds.
- On the X-axis, you see each day from the time range.
- On the Y-axis, you see the number of visitors that passed the threshold for a specific persona.
To see a tooltip with the exact number of visitors for each persona, hover over a specific day in the chart.
By default, you see the three personas with the most passed thresholds. If you want to select other personas, click  (Change).
A new dialog appears where you can select any number of desired personas.
NOTE: Personas with zero visitors, who passed the threshold, are not displayed and you cannot select them.
Persona details
You use this section to get more statistics for your personas. The following measurements are available:
- Visitors for the last … days column.
It displays the number of visitors who entered the persona during the selected time range.
It also displays the ratio of visitors who entered the persona to the number of all visitors who entered any persona, during the selected time range.
- Visitors for all time column.
It displays the number of visitors currently belonging to the persona and the ratio of visitors currently in the persona to all visitors belonging to all personas in the data center.
- Contacts for last … days column.
It displays information about all contacts that were associated with this persona in the selected time range.
- Contacts for all time column.
It displays information about all contacts that have been associated with this persona since the data center was created.
To see detailed statistics for a persona, click the persona’s name.
For more information, see Detailed persona report.
Conversions by persona
In this section, you see a heatmap representing how well different personas convert.
- In the columns, you see all conversions that have at least one attribution to any persona in the selected time range.
- In the rows, you see all defined personas.
To help you better frame how successful your personas convert, the heatmap displays the personas that do not have attributed to any conversions.
The heatmap colors go from white – no conversions, to dark green – the highest number of conversions. To see the exact number of conversions, hover over the heatmap cells.